S&P500 and NYSE composite have set an all-time high during the past week, however, this was not confirmed by the other Majors with the Nasdaq potentially setting a lower high point. I often refer to larger time frames “Primary trends”, while all are within the confines of a Primary UP trend, they do need to confirm each other, at present they do not, with a divergence between the Nasdaq and the S&P. This should be monitored for further divergence and a potential major top reversal signal.
Historically October is a bullish month and there is no evidence to suggest otherwise for this October.
The China Evergrande debt saga is not over, and further news may adversely move the markets, in particular, the threat of contagion to other credit providers in the real estate sector.
Oil has put in a new high and is now targeting the 2014 high of over $100.0bl.
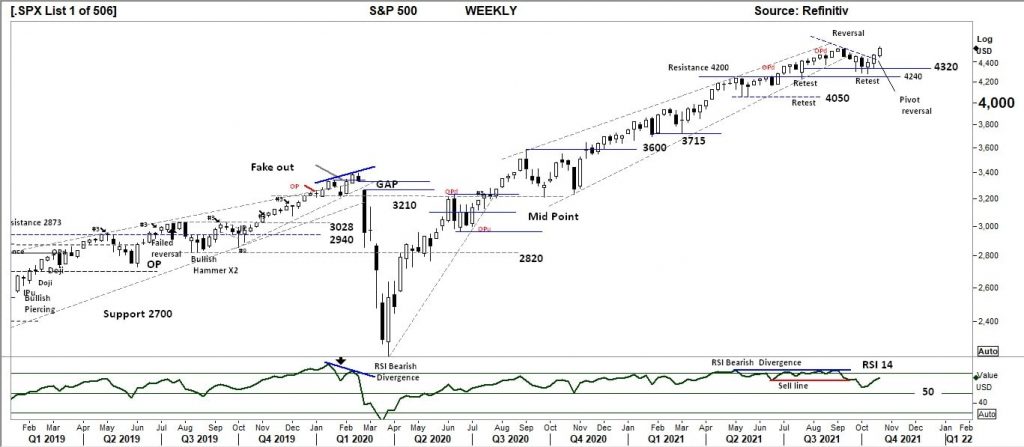
S&P 500 Weekly
Price structure
The S&P has set a great technical signal for higher prices with the close of last week towards the high and setting an all-time high closing price. The NYSE also set a new all-time high. On a cautionary note, with the market at the highs, profit-taking may take place. Should the market retrace the first level of support remains at 4320.
Indicator: Relative Strength Indicator 14
A signal of increasing momentum as the Relative Strength Indicator (14) turns higher on the 2nd of large range price movements of last week and the week prior. The Relative Strength Indicator is in a good place for further strength, a movement over the 70 levels would indicate strong price momentum. Historically the indicator can remain over the 70 levels for an extended period of time as seen during July – September.
Comments from last week
A strong pivot point from the 4320-support level is a good signal for the continuation of the UP trend. The strong gain in technology stock continues to underpin the markets. However, failure of the Index to set a new high in the coming weeks would be a bearish signal, traders should be aware a breakdown of the 4240 level would put the index into a downtrend. At this point in the chart, the strong range of last week suggests continuation higher.
The underlying Primary trend is UP.
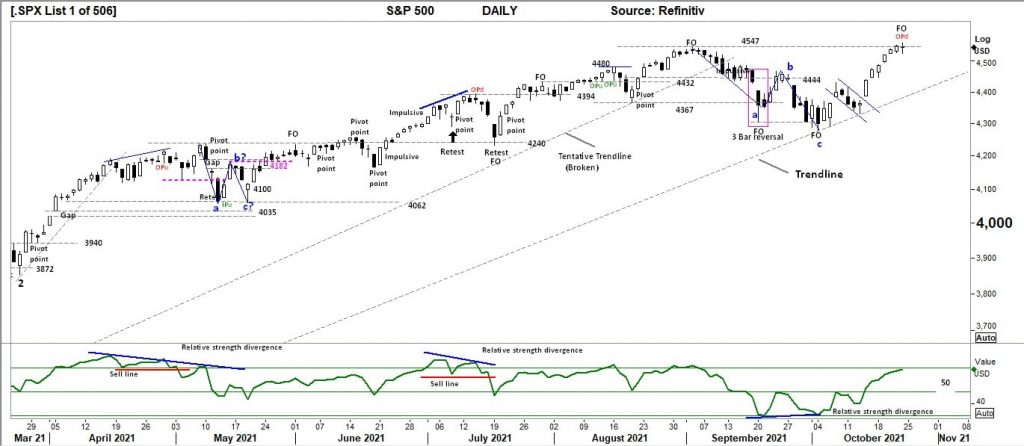
S&P 500 DAILY
Price structure
The cautionary note in the Weekly chart comes from the Daily observation of an OP (outside period) set on Friday. This type of range has a statistical significance of marking market turning points. The past week is showing several “gaps”, a price decline from this level would be looking to fill the gaps for a potential retest of the Trendline. The S&P has made an extended price movement this type of 8-day price gain is subject to short term profit-taking.
Indicator: Relative Strength 14
Relative Strength Indicator (14) has turned higher over the 50 levels a signal of underlying positive price momentum, a further movement over 70 would indicate a further strong price momentum. A close below the 50 levels would alert traders to failing upward price momentum.
Comments from last week
The S&P has a new “tentative” trendline in place as the reversal has set a pivot point Wednesday – Thursday last week. The index is leaving several open Gaps, these areas will be monitored for support on any price retracement in the coming days. With the 4444 level now cleared, the all-time high of 4536 remains the first target in this Primary Bull market move. The common picture across all markets (indices) is the potential broadening top pattern beginning from June 2021.
Currently, the primary trend remains UP.
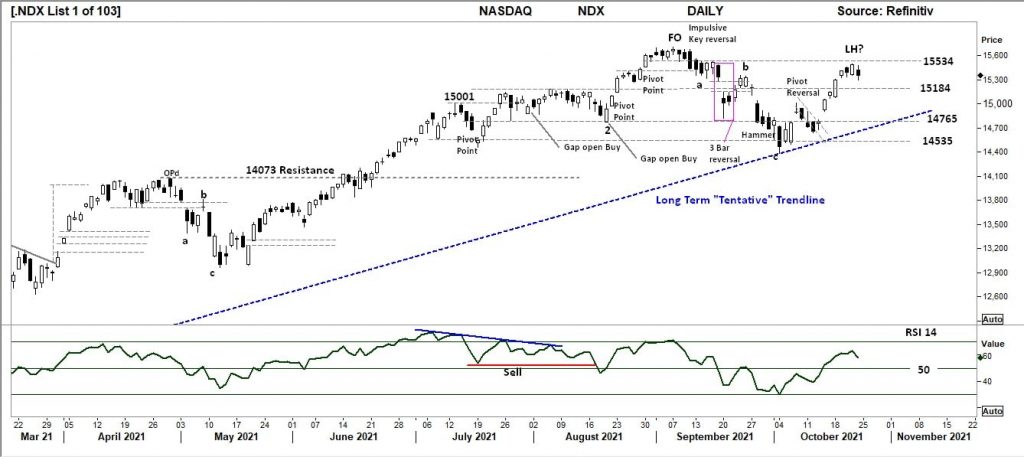
NASDAQ Daily
Price structure:
The chart of the Nasdaq is of concern, the first observation is the potential “lower high” coming into place below the 15534 level. The first level of support during any price retracement is 15184 followed by the 14765 level intersecting the Trendline. The broader observation is the Nasdaq is setting a broad topping pattern beginning from the month of July. The broader risk is a follow on with other Indices as many Nasdaq equities are weighted into the S&P500.
Indicator: Relative Strength 14
Relative Strength Indicator moving over the 50 levels is a strong sign of improving price momentum, however, the current downturn should be monitored for further declines.
Comments from last week
As with the S&P the Nasdaq is gapping higher, given the chart structure of the past 2 months the risk is the current move could be the euphoric exhaustion move common at the top of extended bull markets. Further evidence of this type of activity would be another Gap higher combined with extended daily price ranges. The growing concern is the formation of a major top pattern, that still may take months to confirm.
The underlying Primary trend is UP.
.
